Monday, January 09, 2006

Ti-Cu Xanes


I redid the Ti XANES fit to match with my fit to the Cu (I did a full 5-gaussian fit to the Ti preedge features to get parameters on the low-E features). I see a correlation between a peak height in the Cu XANES and several peak heights in the Ti XANES.

Friday, December 30, 2005

Dielectric correlation


I see a slight correlation between the dielectric parameter sigma (obtained from the 0.1 Hz data of fig 1 in PRB v70 p172102) and the peak height of peak 2 for the Ti-XANES data. I should check the correlation between sigma and Ti-O bond length next.

Thursday, December 29, 2005

No temperature dependence in Cu XANES


I see no temperature-dependent features in the Cu XANES, do you?

1/3/06 sidenote: Shouldn't there be though? At least in the main white-line?

Thursday, December 22, 2005

Correlation between Ti-O bondlength and Ti-3+ Concentration


I see a linear correlation between the amplitude of peak 2 and the length of the ti-o bond reported from Ti-K EXAFS! As the Ti-3+ concentration increases, so does the ti-o average bondlength. No perceviable change in the Ti-O PDF width was noticeable (I subtracted a fitted Debye model + static offset to check), as all deviations from the debye model were within error bars (except the low-T point). I believe that this change in bondlength is consistent with reports of polarons involving Ti-3+ ions in the Ti-O octahedra.

Charge Transfer from O->Ti

I realized this morning that the previous post indicates charge transfer as opposed to hybridization because the changes in peak 3 and peak 2 are positively correlated. Previous literature (Phys Rev B v 56 p 1809) and calculations by FEFF indicate that peak 3 is due to a transition from Ti to the O 2p states (they also suggest that it could be a transition to a Ti d-state). If we attribute changes in peak 2 to changes in the Ti 3+ concentration, then the peak2-3 correlation says that the occupancy of the O 2p states is decreasing while the concentration of Ti-3+ ions is increasing.

If this is the case, then I predict that we should see some small changes in the Ti-O PDF that correlate with the changing state occupancy as temperature increases: either a small change in bond length, or a change in non-debye and non-static PDF width.

Friday, December 16, 2005

Ti XANES


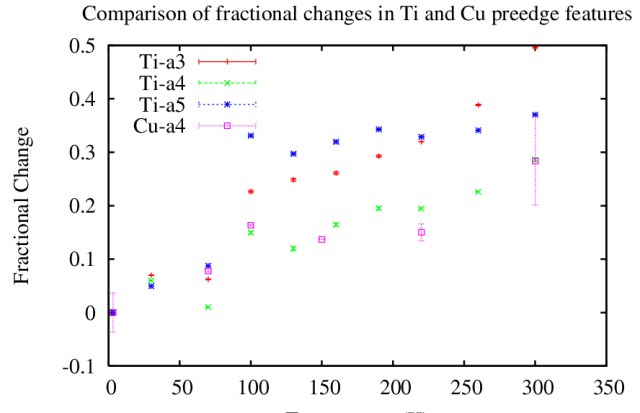
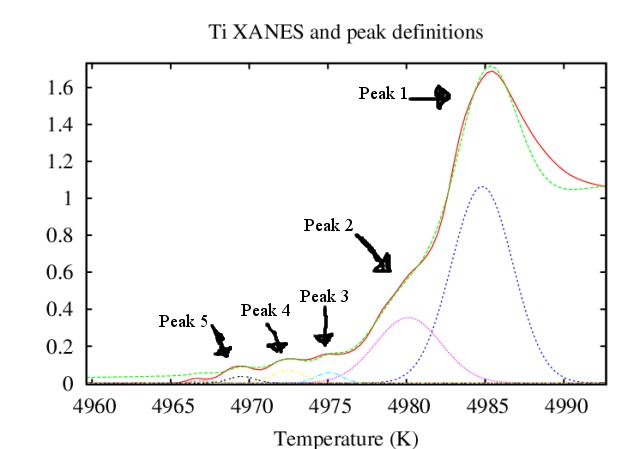
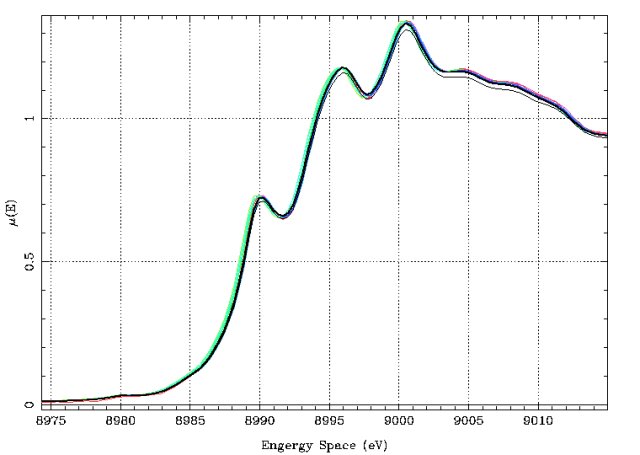
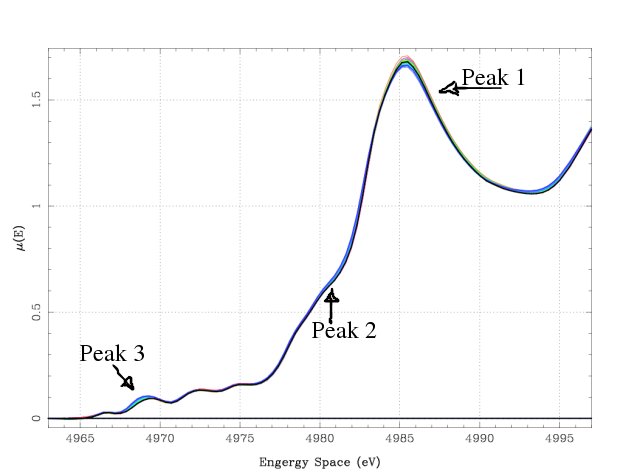
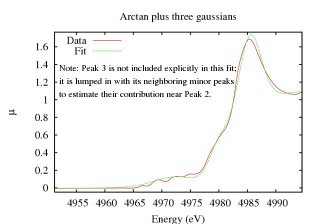
I am looking at the Ti XANES since a concentration of 3+ should show up in the preedge region. I have found two temp-dependent pre-edge features, one at about 4968 eV (Peak 3) and the other at about 4984 eV (Peak 2). Their amplitudes have a very similar temperature dependence.

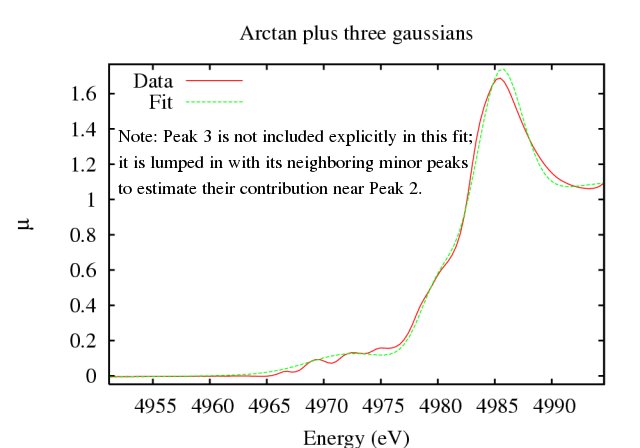
I used Gnuplot to extract parameters for Peaks 1 and 2 by fitting the entire edge to a sum of arctan and gaussian functions:
y(E)=2*At/pi*atan((E-E0)/del)+A1*exp(-(E-E0)^2/S1^2)+A2*exp(-(E-E2)^2/S2)+A3*exp(-(E-E3)^2/S3)+At-d
with A1,S1 correspond to Peak 1, A2,E2,S2 correspond to Peak 2 and so on.


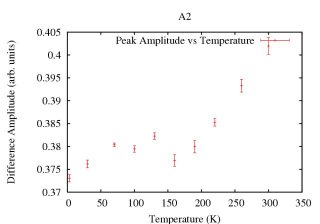
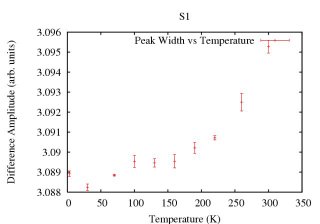
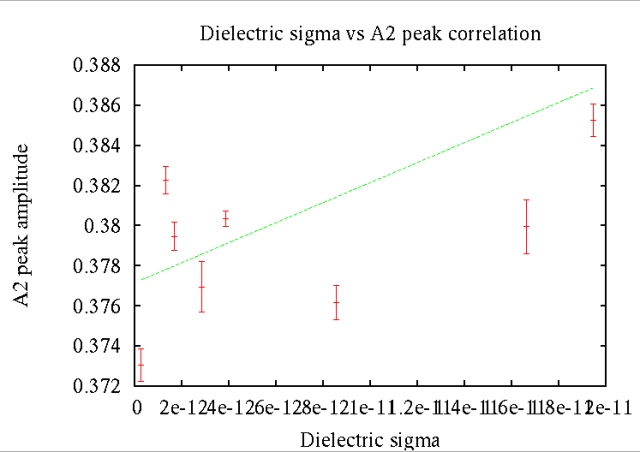
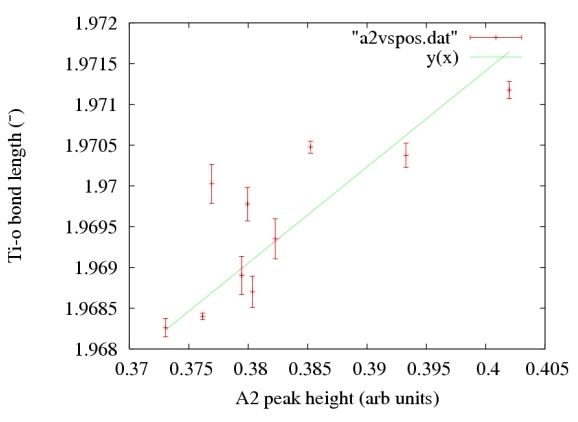
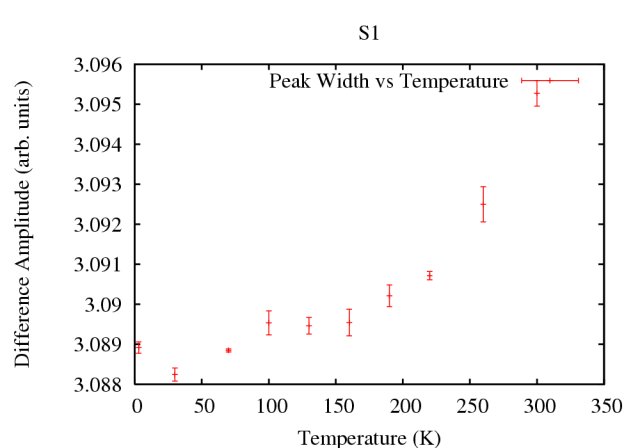
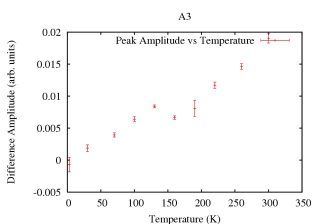
That yielded these interesting plots for A2 and S1. Note the kink in both plots in the 100-150K region, which is very near where the high dielectric constant kicks in.

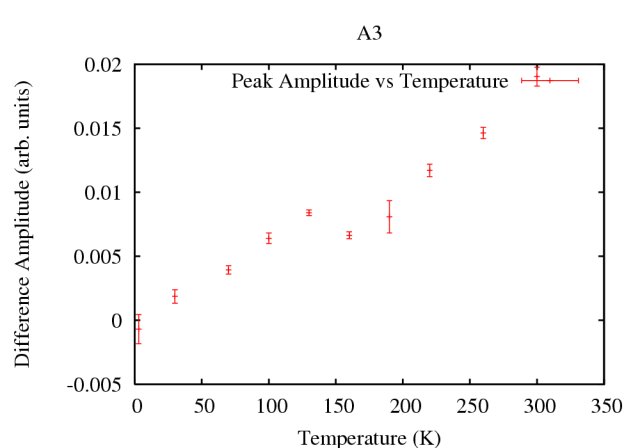
For Peak 3, I fit a gaussian to difference data (difference relative to one of the low-Temperature e-space files) in the peak 3 region to explore changes in the amplitude of peak three. The plot below shows the absolute amplitude change as a function of temperature. It has the same temperature dependence as A2!


Bud says that changes in the amplitude of peaks 2 and 3 indicate one of the two things: 1.) charge is transferring to or from the Ti site, or 2.) the hybridization of the d-orbitals is changing due to bond-length change. Either way, the electronic structure around Ti is changing as a function of temperature, with a kink near the dielectric transition. Very exciting.

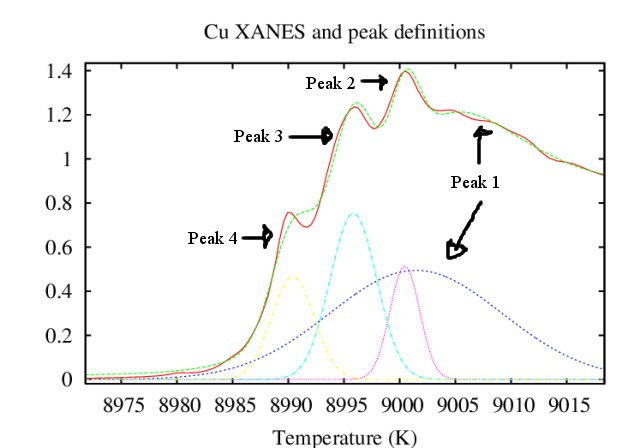
We should look at the other edges to see if there is evidence of charge transfer there too, particularly Cu.

Thursday, December 15, 2005

CCTO

The purpose of this blog is to log the progress of analysis of CaCu3Ti4O12 (a colossal dielectric constant material) in Bud Bridges lab. We primarily use XAFS techniques (EXAFS and XANES) to glean structural and electronic information about the systems we study. In this system in particular, we are checking for odd local-structure behavior which may explain the high dielectric constant of the material.

The vast bulk of literature on this material screams that the high dielectric constant is caused by extrinsic properties of the material; that is, an ideal, stoichiometric sample would not exhibit this property becuase it is caused by deviations from the ideal crystal structure. The leading theory at the moment is that the high dielectric constant is caused by "grain-boundary effects" in which structural abberations form in parallel layers that form a chain of capacitors, which effectively sum to be a giant capacitor--if this is the case, then the EXAFS will probably not show any odd behavior, though fits may not be good-quality because of signal pollution from the heterogenous boundary regions (homogeny is our friend in EXAFS).

Another point of interest on this material: Zhang et al (Zhang, L and Tang, Z-J, Phys Rev B, v 70, p 174306) claim that polarons exist within the material and are responsible for the conductivity of the material; this requires that a mixture of Ti3+ and Ti4+ ions must exist in the crystal (which is a deviation from the ideal stoichiometery). XANES analysis of the Ti-edge gives us the ability to quantify the concentrations of the 3+ and 4+ ions within the sample, as well as probe the temperature dependence of these concentrations. A changing concentration would imply charge transfer to or from the Ti ions, which would be incredibly interesting and possibly relevant to the explanation of the high dielectric constant. (NOTE: the 3+/4+ concentrations are extrinsic features of the system since the 3+ ions would have to be compensated by defects (i.e. regional oxygen deficiency)).