Ti XANES


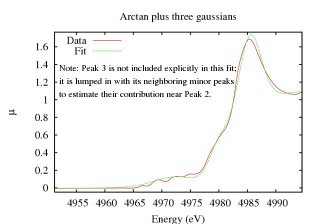
I am looking at the Ti XANES since a concentration of 3+ should show up in the preedge region. I have found two temp-dependent pre-edge features, one at about 4968 eV (Peak 3) and the other at about 4984 eV (Peak 2). Their amplitudes have a very similar temperature dependence.
I used Gnuplot to extract parameters for Peaks 1 and 2 by fitting the entire edge to a sum of arctan and gaussian functions:
y(E)=2*At/pi*atan((E-E0)/del)+A1*exp(-(E-E0)^2/S1^2)+A2*exp(-(E-E2)^2/S2)+A3*exp(-(E-E3)^2/S3)+At-d
with A1,S1 correspond to Peak 1, A2,E2,S2 correspond to Peak 2 and so on.


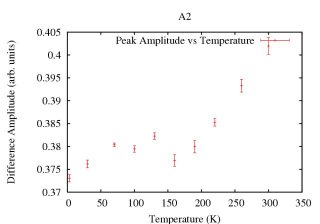
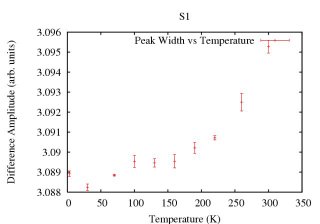
That yielded these interesting plots for A2 and S1. Note the kink in both plots in the 100-150K region, which is very near where the high dielectric constant kicks in.
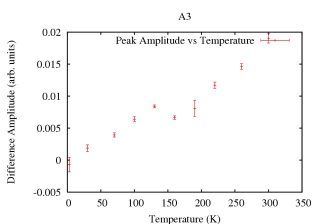
For Peak 3, I fit a gaussian to difference data (difference relative to one of the low-Temperature e-space files) in the peak 3 region to explore changes in the amplitude of peak three. The plot below shows the absolute amplitude change as a function of temperature. It has the same temperature dependence as A2!

Bud says that changes in the amplitude of peaks 2 and 3 indicate one of the two things: 1.) charge is transferring to or from the Ti site, or 2.) the hybridization of the d-orbitals is changing due to bond-length change. Either way, the electronic structure around Ti is changing as a function of temperature, with a kink near the dielectric transition. Very exciting.
We should look at the other edges to see if there is evidence of charge transfer there too, particularly Cu.

0 Comments:
Post a Comment
<< Home